
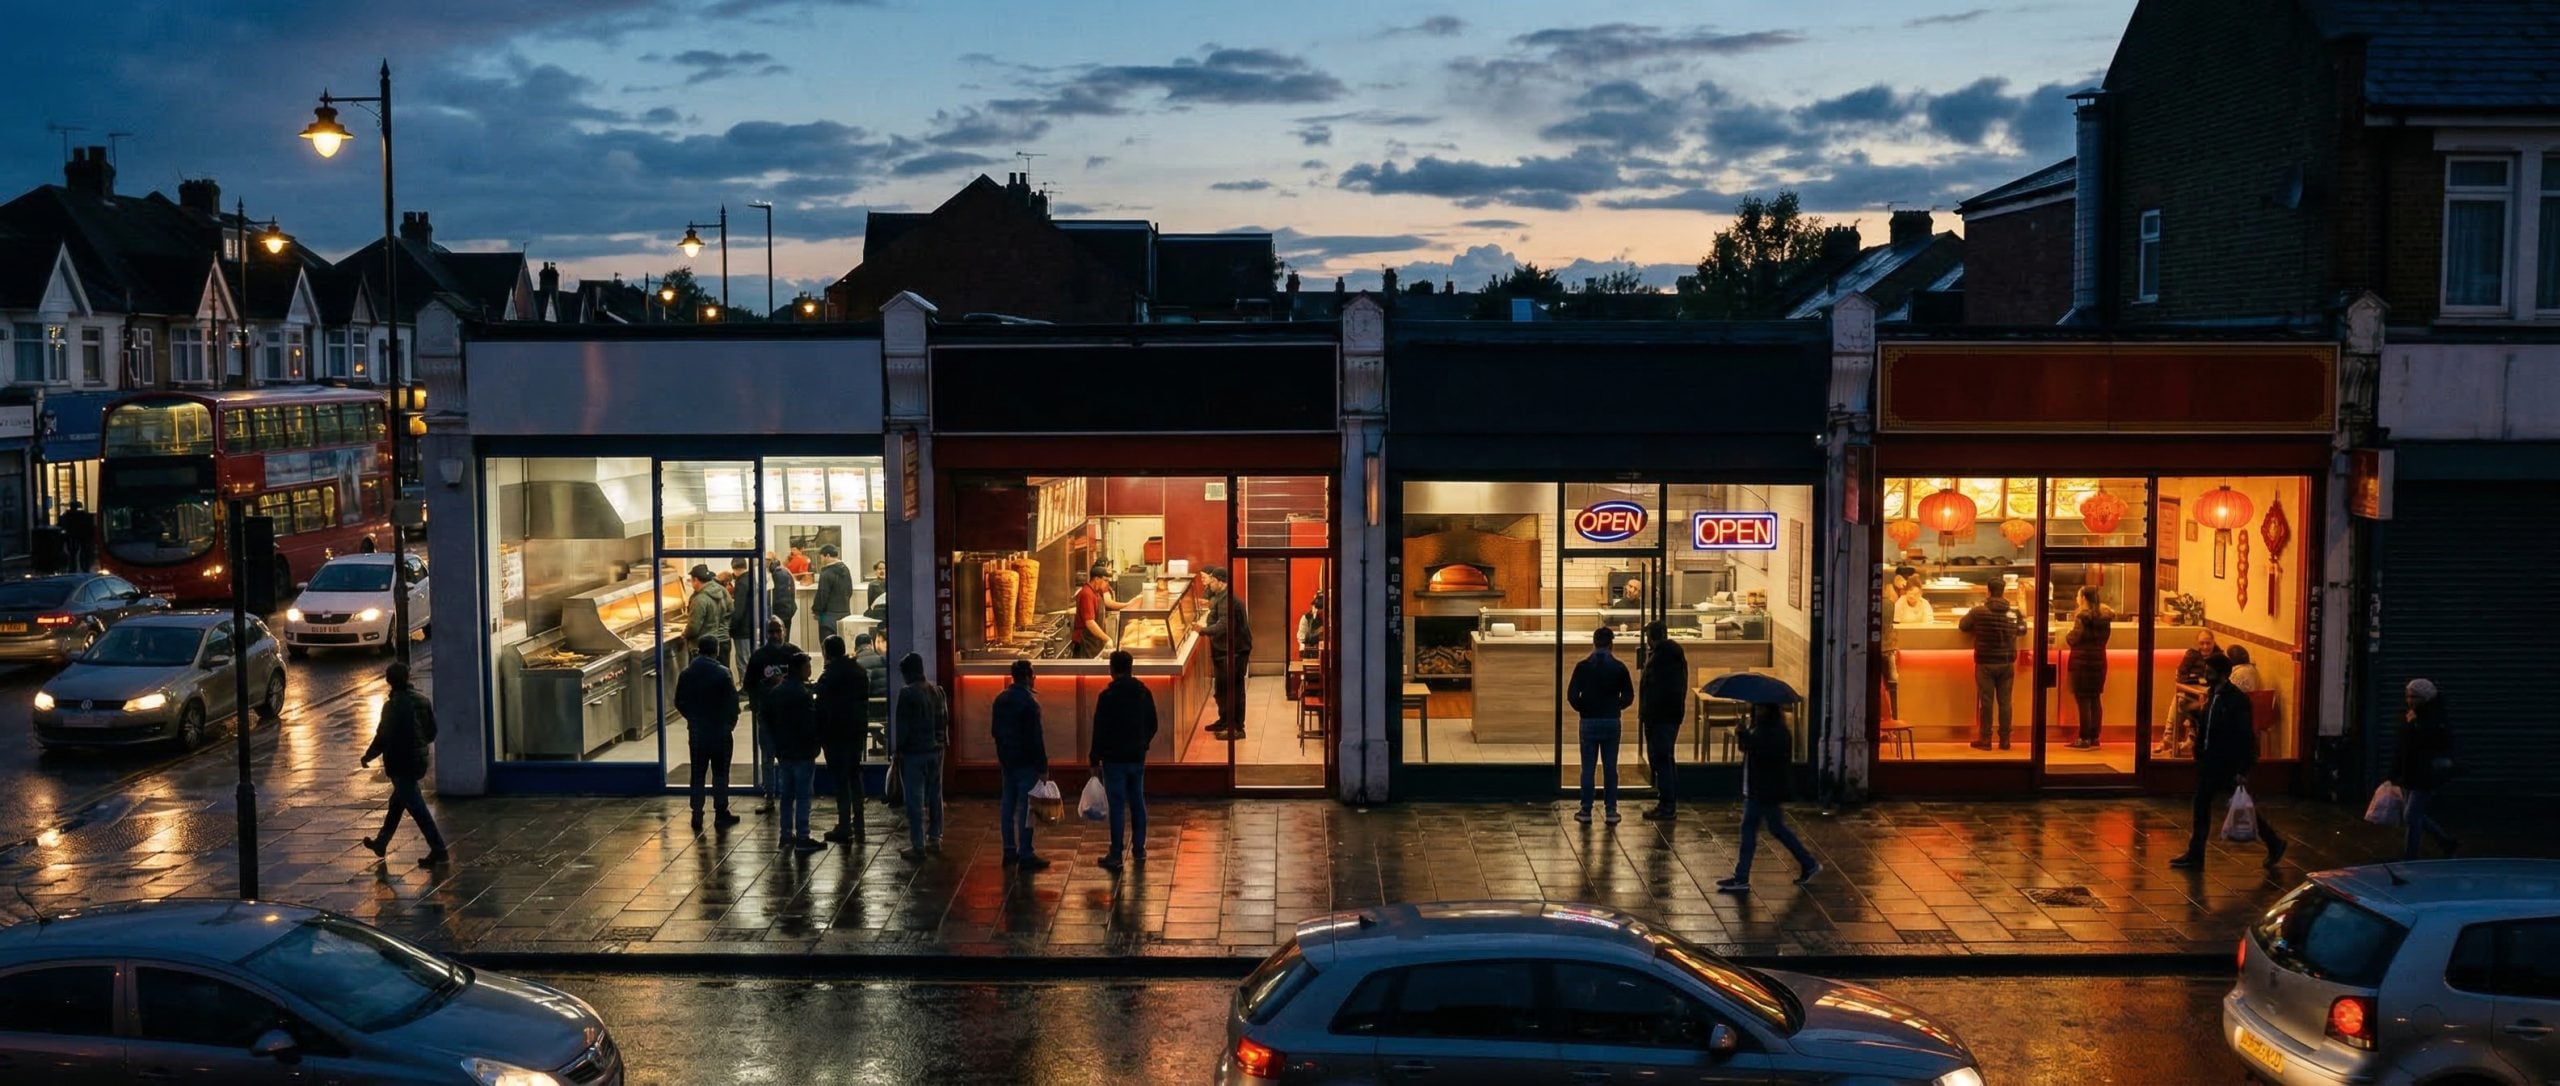
An original analysis of Food Standards Agency data reveals which UK cities have the highest concentration of takeaway businesses, how they compare to restaurants and pubs, and where the country’s takeaway density is strongest per head of population.
63,047 Registered Takeaways: The UK at a Glance
The Food Standards Agency currently lists 63,047 active takeaway and sandwich shop establishments across the United Kingdom. To put that number in context, there are 138,916 restaurants, cafes and canteens, and 50,783 pubs, bars and nightclubs on the same register. Takeaways sit right in the middle, but when it comes to new business registrations, they are growing faster than either of the other two categories.
We went through the FSA establishment data and mapped every single registered takeaway to its local authority area. The result is a complete picture of where Britain’s takeaway businesses are concentrated, and where the gaps still exist.
63,047 takeaways. 138,916 restaurants. 50,783 pubs. The UK has more registered takeaways than pubs for the first time.
The Top 20: Which Cities Have the Most Takeaways?
The ranking below covers every local authority area in the UK, sorted by the total number of registered takeaway and sandwich shop establishments.
| Rank | Local Authority | Takeaways | Per 10k Pop | Restaurants | Pubs |
| 1 | Glasgow City | 1,106 | 17.0 | 2,133 | 355 |
| 2 | Birmingham | 1,048 | 9.1 | 2,517 | 491 |
| 3 | Leeds | 811 | 10.0 | 1,876 | 610 |
| 4 | Camden | 792 | 36.3 | 1,741 | 236 |
| 5 | Manchester | 769 | 13.3 | 1,995 | 464 |
| 6 | Liverpool | 751 | 15.1 | 1,005 | 518 |
| 7 | Bradford | 687 | 12.5 | 923 | 434 |
| 8 | Edinburgh (City of) | 681 | 12.6 | 1,944 | 504 |
| 9 | Sheffield | 615 | 10.8 | 1,447 | 345 |
| 10 | Southwark | 582 | 18.8 | 958 | 197 |
| 11 | Kirklees | 576 | 13.1 | 609 | 474 |
| 12 | Durham | 573 | 10.7 | 777 | 635 |
| 13 | Leicester City | 550 | 15.0 | 736 | 154 |
| 14 | Brent | 495 | 15.0 | 556 | 80 |
| 15 | North Yorkshire | 486 | 7.8 | 1,800 | 773 |
| 16 | Coventry | 476 | 12.5 | 549 | 168 |
| 17 | Wakefield | 465 | 13.2 | 555 | 328 |
| 18 | Bristol | 454 | 9.5 | 1,485 | 407 |
| 19 | Fife | 447 | 11.8 | 698 | 397 |
| 20 | Croydon | 442 | 11.3 | 597 | 75 |
Glasgow City leads the entire United Kingdom with 1,106 registered takeaway establishments, narrowly ahead of Birmingham (1,048). But the raw numbers only tell part of the story. When you adjust for population, the picture changes significantly.
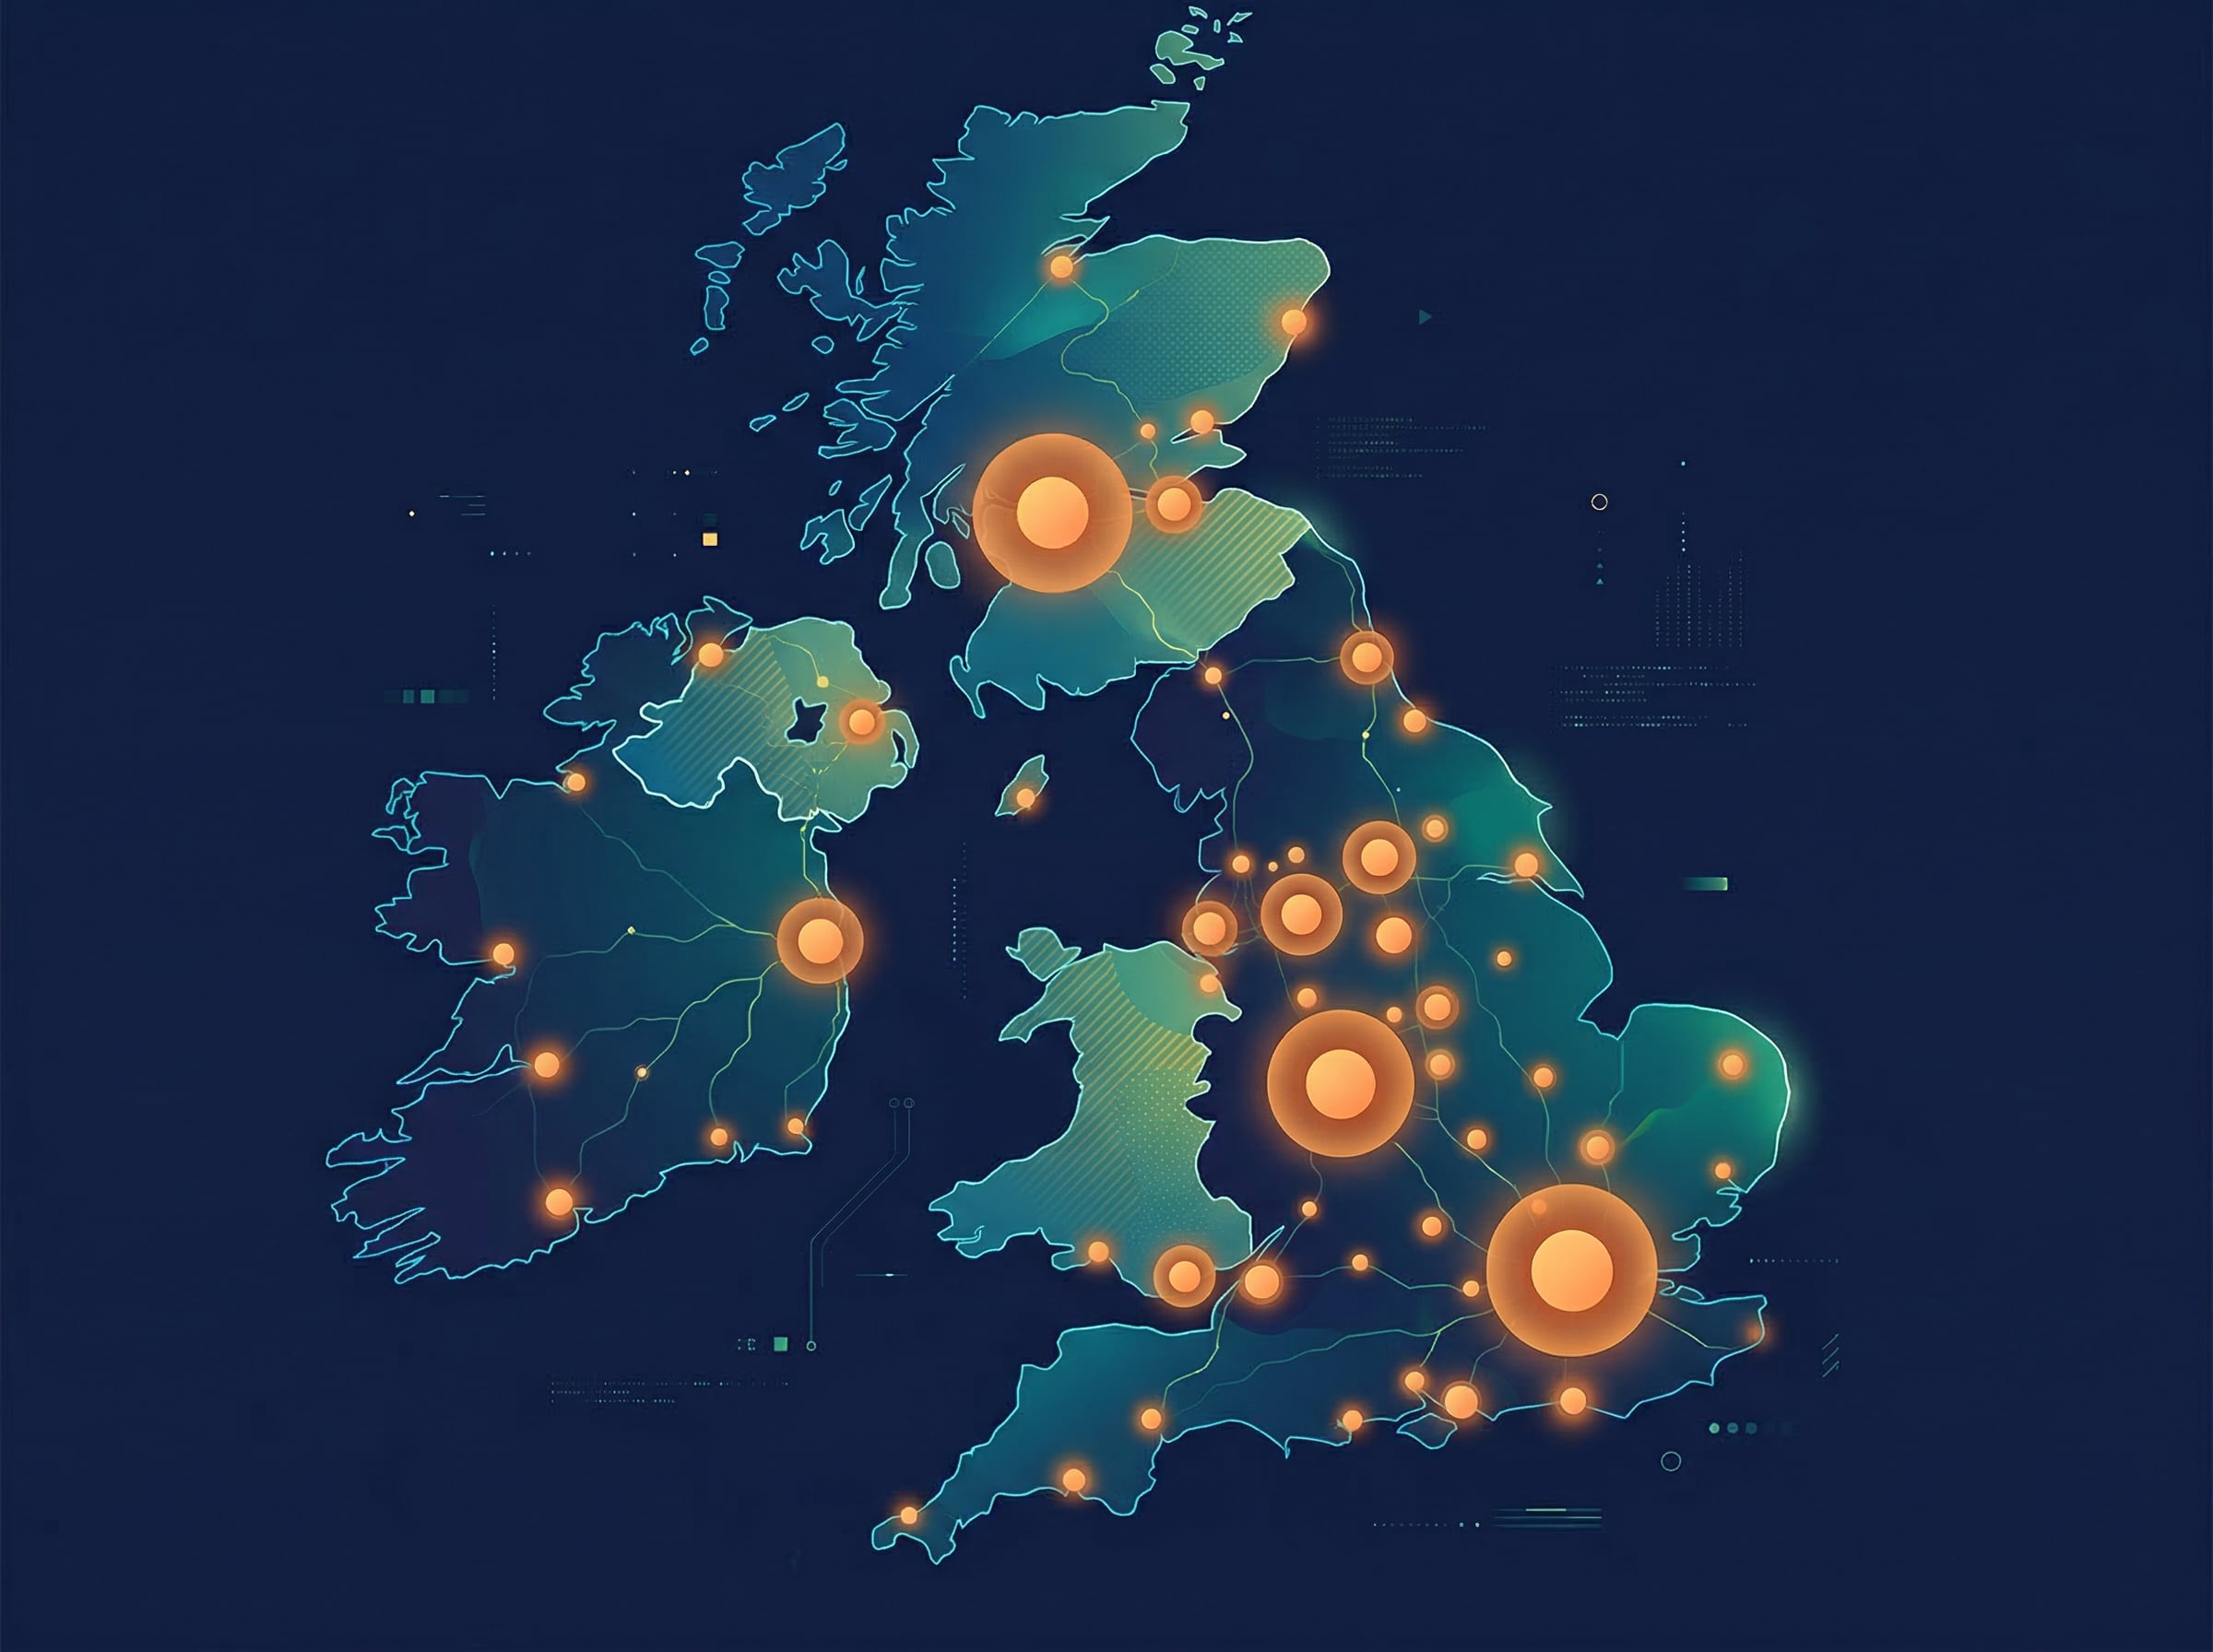
Takeaway Density: The Real League Table (Per 10,000 Population)
A city with a million residents will naturally have more takeaways than a town with 100,000. To get a fair comparison, we calculated the number of takeaway establishments per 10,000 residents for every local authority where population data is available.
| Rank | Local Authority | Takeaways | Population | Per 10,000 |
| 1 | Camden | 792 | 218,200 | 36.3 |
| 2 | Blackpool | 281 | 141,040 | 19.9 |
| 3 | Southwark | 582 | 308,900 | 18.8 |
| 4 | East Lindsey | 263 | 145,400 | 18.1 |
| 5 | Glasgow City | 1,106 | 650,300 | 17.0 |
| 6 | Liverpool | 751 | 496,784 | 15.1 |
| 7 | Brent | 495 | 329,800 | 15.0 |
| 8 | Leicester City | 550 | 366,587 | 15.0 |
| 9 | Rochdale | 335 | 224,170 | 14.9 |
| 10 | Dundee City | 205 | 149,320 | 13.7 |
| 11 | Sunderland | 379 | 277,090 | 13.7 |
| 12 | Hull City | 353 | 259,800 | 13.6 |
| 13 | Manchester | 769 | 576,459 | 13.3 |
| 14 | Wakefield | 465 | 351,838 | 13.2 |
| 15 | Stockport | 387 | 294,770 | 13.1 |
Camden has the highest takeaway density among major local authorities, with 36.3 takeaway establishments for every 10,000 residents. That means roughly one takeaway for every 275 people.
The density figures reveal something the raw rankings miss. Some areas that sit lower in the total count rankings are actually far more saturated with takeaway businesses relative to their population. For anyone thinking about where to open a new takeaway, density is arguably a better guide than total numbers, because it tells you how much competition you are actually up against.
England, Scotland, Wales, Northern Ireland: A Regional Comparison
Splitting the data by nation reveals some striking differences in how takeaway culture varies across the UK.
| Nation | Takeaways | Per 10k Pop | Restaurants | Pubs |
| England (total) | 52,009 | 9.0 | 116,234 | 42,689 |
| Scotland | 6,167 | 11.2 | 12,497 | 3,960 |
| Wales | 3,105 | 9.9 | 6,748 | 3,128 |
| Northern Ireland | 1,766 | 9.2 | 3,437 | 1,006 |
A few things stand out from the regional comparison:
- Scotland punches above its weight. Scotland has 11.2 takeaways per 10,000 residents compared to England’s 9.0. On a per-capita basis, Scotland is one of the most takeaway-dense parts of the UK
- Glasgow and Edinburgh dominate. Glasgow alone accounts for more than a fifth of all Scottish takeaways, and Edinburgh adds another 681. Between them, the two cities hold nearly a third of Scotland’s entire takeaway market
- The North and Midlands lead in England. Northern and Midlands cities (Leeds, Bradford, Sheffield, Kirklees, Durham, Leicester) fill the top 20 in raw numbers, reflecting the strong chip shop and takeaway curry tradition across these regions
- London is fragmented but massive. London’s individual boroughs appear separately in the rankings (Camden at 4th, Southwark at 10th, Brent at 14th). Combined, London has 9,804 takeaways across all its boroughs, putting the capital in a category of its own
REGIONAL PRESS ANGLE: Glasgow is the takeaway capital of the UK. With 1,106 registered establishments, it has more takeaways than any other single local authority area in Britain, including Birmingham, Manchester, and every individual London borough.
Takeaways vs Restaurants vs Pubs: How the Food Business Landscape Varies by City
The balance between takeaways, restaurants, and pubs varies dramatically depending on where you are in the country. In some cities, takeaways outnumber restaurants. In others, the restaurant scene dominates. And in rural areas, pubs are often the most common food establishment of all.
| City | Takeaways | Restaurants | Pubs | Total | Takeaway % |
| Glasgow City | 1,106 | 2,133 | 355 | 3,594 | 31% |
| Birmingham | 1,048 | 2,517 | 491 | 4,056 | 26% |
| Leeds | 811 | 1,876 | 610 | 3,297 | 25% |
| Camden | 792 | 1,741 | 236 | 2,769 | 29% |
| Manchester | 769 | 1,995 | 464 | 3,228 | 24% |
| Liverpool | 751 | 1,005 | 518 | 2,274 | 33% |
| Bradford | 687 | 923 | 434 | 2,044 | 34% |
| Edinburgh (City of) | 681 | 1,944 | 504 | 3,129 | 22% |
| Sheffield | 615 | 1,447 | 345 | 2,407 | 26% |
| Bristol | 454 | 1,485 | 407 | 2,346 | 19% |
| Newcastle Upon Tyne | 332 | 834 | 265 | 1,431 | 23% |
| Nottingham City | 416 | 607 | 240 | 1,263 | 33% |
| Belfast City | 414 | 901 | 182 | 1,497 | 28% |
| Cardiff | 266 | 875 | 188 | 1,329 | 20% |
| Brighton and Hove | 254 | 1,002 | 340 | 1,596 | 16% |
What the comparison tells us:
- Bradford has the highest takeaway share of any major city. Takeaways outnumber both restaurants and pubs in Bradford, reflecting the city’s deep-rooted takeaway curry culture
- Camden and Edinburgh have restaurant-heavy profiles. In both areas, restaurants outnumber takeaways by more than 2:1, driven by tourism and dining-out culture
- Liverpool and Glasgow lean heavily towards takeaways. Both cities have more takeaway establishments than restaurants, which fits with the strong chip shop and kebab shop tradition in both places
- Rural areas like North Yorkshire and Cornwall (not shown above) have high pub counts relative to takeaways, reflecting the traditional village pub model
Food Hygiene Standards Across the UK’s Takeaway Hotspots
With 63,047 takeaways registered, an obvious question is: how are they performing on food hygiene? The FSA rates food businesses from 0 (urgent improvement necessary) to 5 (very good). Scotland and Northern Ireland use separate Pass/Fail systems.
| Rating | Establishments | % of Rated |
| 5 (Very Good) | 31,771 | 60.8% |
| 4 (Good) | 10,462 | 20.0% |
| 3 (Generally Satisfactory) | 7,011 | 13.4% |
| 2 (Improvement Necessary) | 1,553 | 3.0% |
| 1 (Major Improvement) | 1,246 | 2.4% |
| 0 (Urgent Improvement) | 174 | 0.3% |
The headline figures are broadly positive:
- Two-thirds (80.9%) of all rated takeaways hold a score of 4 or 5, meaning “Good” or “Very Good”
- Just 2.7% have a rating of 0 or 1, indicating serious food safety problems
- 5,342 takeaways are still awaiting their first inspection. These are most likely recent registrations that local authorities have not yet visited, which lines up with the strong new registration volumes we are seeing across the sector
What 63,047 Takeaways Means for Catering Equipment Demand
Every takeaway on the FSA register runs a commercial kitchen. Every one of those kitchens contains equipment that needs to be purchased, replaced, or upgraded. When you look at the geographical distribution, the implications for equipment suppliers are clear.
The highest-density takeaway areas also tend to be the areas where:
- Equipment replacement cycles are shorter, because high-volume takeaway kitchens work their fryers, fridges, and ovens harder than lower-volume restaurant kitchens
- Price sensitivity is highest, because takeaway margins are tight and operators are constantly looking for ways to reduce overheads
- Competition drives upgrades, because a new competitor opening down the road often prompts an existing operator to refresh their kitchen
For anyone setting up a new takeaway, the standard kitchen fit-out includes a commercial fryer, commercial oven or combi oven, prep counter fridge, commercial fridge and freezer, bain marie, stainless steel prep tables, commercial sink, and extraction ventilation. At full retail prices, that represents an investment of £15,000 to £35,000.
B-Grade equipment offers the same kit at 30 to 50% less. Every item is brand new, comes with a full manufacturer warranty, and meets all hygiene and safety standards. The only difference is cosmetic. For the 63,047 takeaway businesses across the UK, and particularly those in the cost-conscious northern and Scottish markets that dominate the rankings, that saving can make the difference between a kitchen that gets built and one that stays on paper.
Browse the full B-Grade range at h2products.co.uk/product-category/b-grade-catering-equipment, or view new equipment at h2products.co.uk/product-category/brand-new.
Frequently Asked Questions
How many takeaways are there in the UK?
As of March 2026, the Food Standards Agency registers 63,047 active takeaway and sandwich shop establishments across the United Kingdom. This figure covers businesses that have registered with their local authority and are on the FSA database. The actual number of takeaway-style food businesses may be slightly higher, as some operate under different business type classifications.
Which UK city has the most takeaways?
Glasgow City has the most takeaways of any single local authority area in the UK, with 1,106 registered takeaway establishments. Birmingham is second with 1,048, followed by Leeds (811), Camden in London (792), and Manchester (769). If you combine all London boroughs, the capital has 9,804 takeaways in total.
How many takeaways are in Glasgow?
Glasgow City has 1,106 registered takeaway and sandwich shop establishments according to FSA data (March 2026). This is the highest count of any local authority area in the United Kingdom. Glasgow also has 2,133 restaurants and 355 pubs registered on the same database.
How many takeaways are in Birmingham?
Birmingham has 1,048 registered takeaway and sandwich shop establishments (FSA, March 2026). It ranks second in the UK behind Glasgow. Birmingham also has 2,517 restaurants and 491 pubs, making it one of the most food-business-dense cities in England.
How many takeaways are in Manchester?
Manchester has 769 registered takeaway establishments (FSA, March 2026), ranking 5th nationally. Combined with Greater Manchester boroughs like Salford (342), Stockport (387), Bolton (352), and Rochdale (335), the Greater Manchester area has well over 3,000 takeaway businesses.
How many takeaways are in London?
London has 9,804 registered takeaway establishments across all its boroughs (FSA, March 2026). The highest individual boroughs are Camden (792), Southwark (582), Brent (495), Croydon (442), and Lambeth (411). London’s takeaways are spread across 33 borough-level local authorities.
Are there more takeaways than pubs in the UK?
Yes. The FSA registers 63,047 takeaway and sandwich shop establishments compared to 50,783 pubs, bars and nightclubs. Takeaways have overtaken pubs as a category across the UK, although pubs still lead in many rural and semi-rural local authority areas.
What food hygiene rating do most takeaways have?
Over two-thirds (80.9%) of rated UK takeaways hold a food hygiene rating of 4 or 5, meaning “Good” or “Very Good”. Half (50.4%) hold the highest possible rating of 5. Only 2.7% have a rating of 0 or 1.
What equipment do I need to open a takeaway?
A standard takeaway kitchen requires a commercial fryer, commercial oven or combi oven, prep counter fridge, commercial fridge and freezer, bain marie or hot holding unit, stainless steel prep tables, a commercial sink, and extraction ventilation. Equipment costs typically run between £15,000 and £35,000 at full retail, but B-Grade equipment can reduce that by 30 to 50%.
Data Sources and Methodology
| Source | Data Used | Access |
| Food Standards Agency API | Establishments endpoint: business type filtering for takeaways (7844), restaurants (1), pubs (7843). All UK local authority areas. | Free public API (ratings.food.gov.uk) |
| ONS Mid-Year Population Estimates | Mid-2024 population estimates by local authority (England & Wales) | ons.gov.uk / nomisweb.co.uk |
| NRS Scotland Population Estimates | Mid-2024 population estimates by council area (Scotland) | nrscotland.gov.uk |
All FSA establishment data is a live snapshot as of March 2026. Population estimates are ONS/NRS mid-2024 figures. Per-capita calculations use these population estimates as the denominator.


