
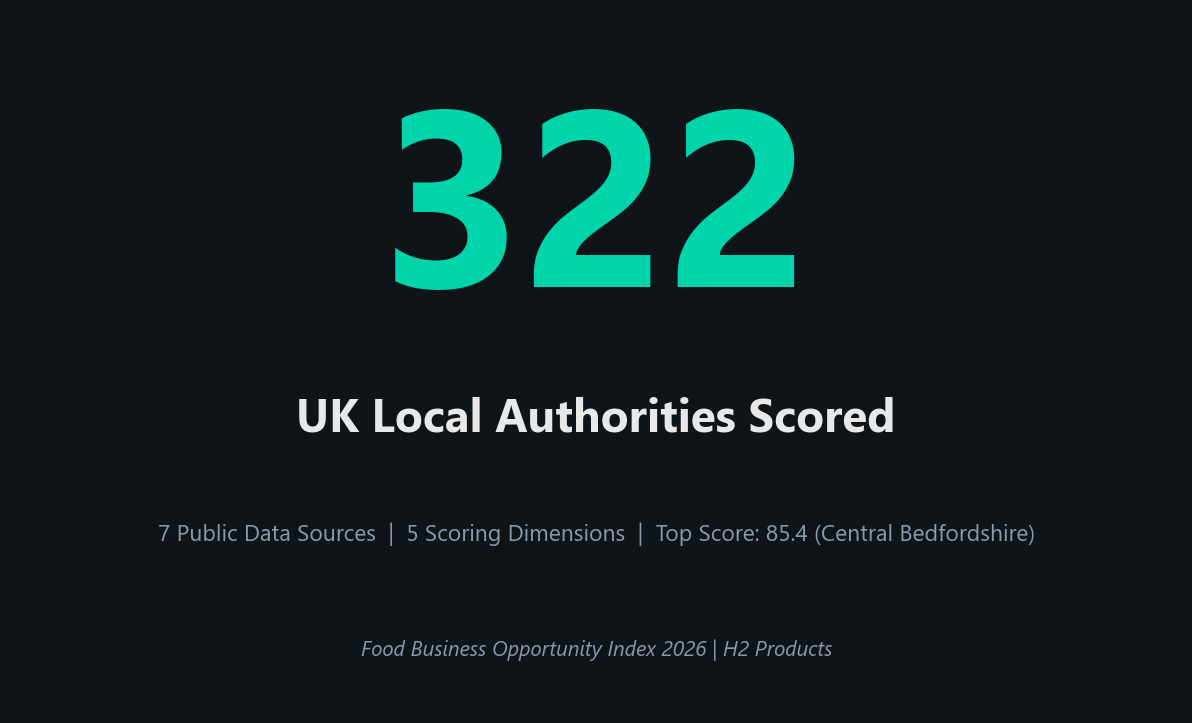
We scored 322 UK local authorities across five dimensions using seven public data sources to build the first composite Food Business Opportunity Index. The result: Central Bedfordshire tops the ranking with a score of 85.4 out of 100.
The Food Business Opportunity Index: How We Scored Every UK Town
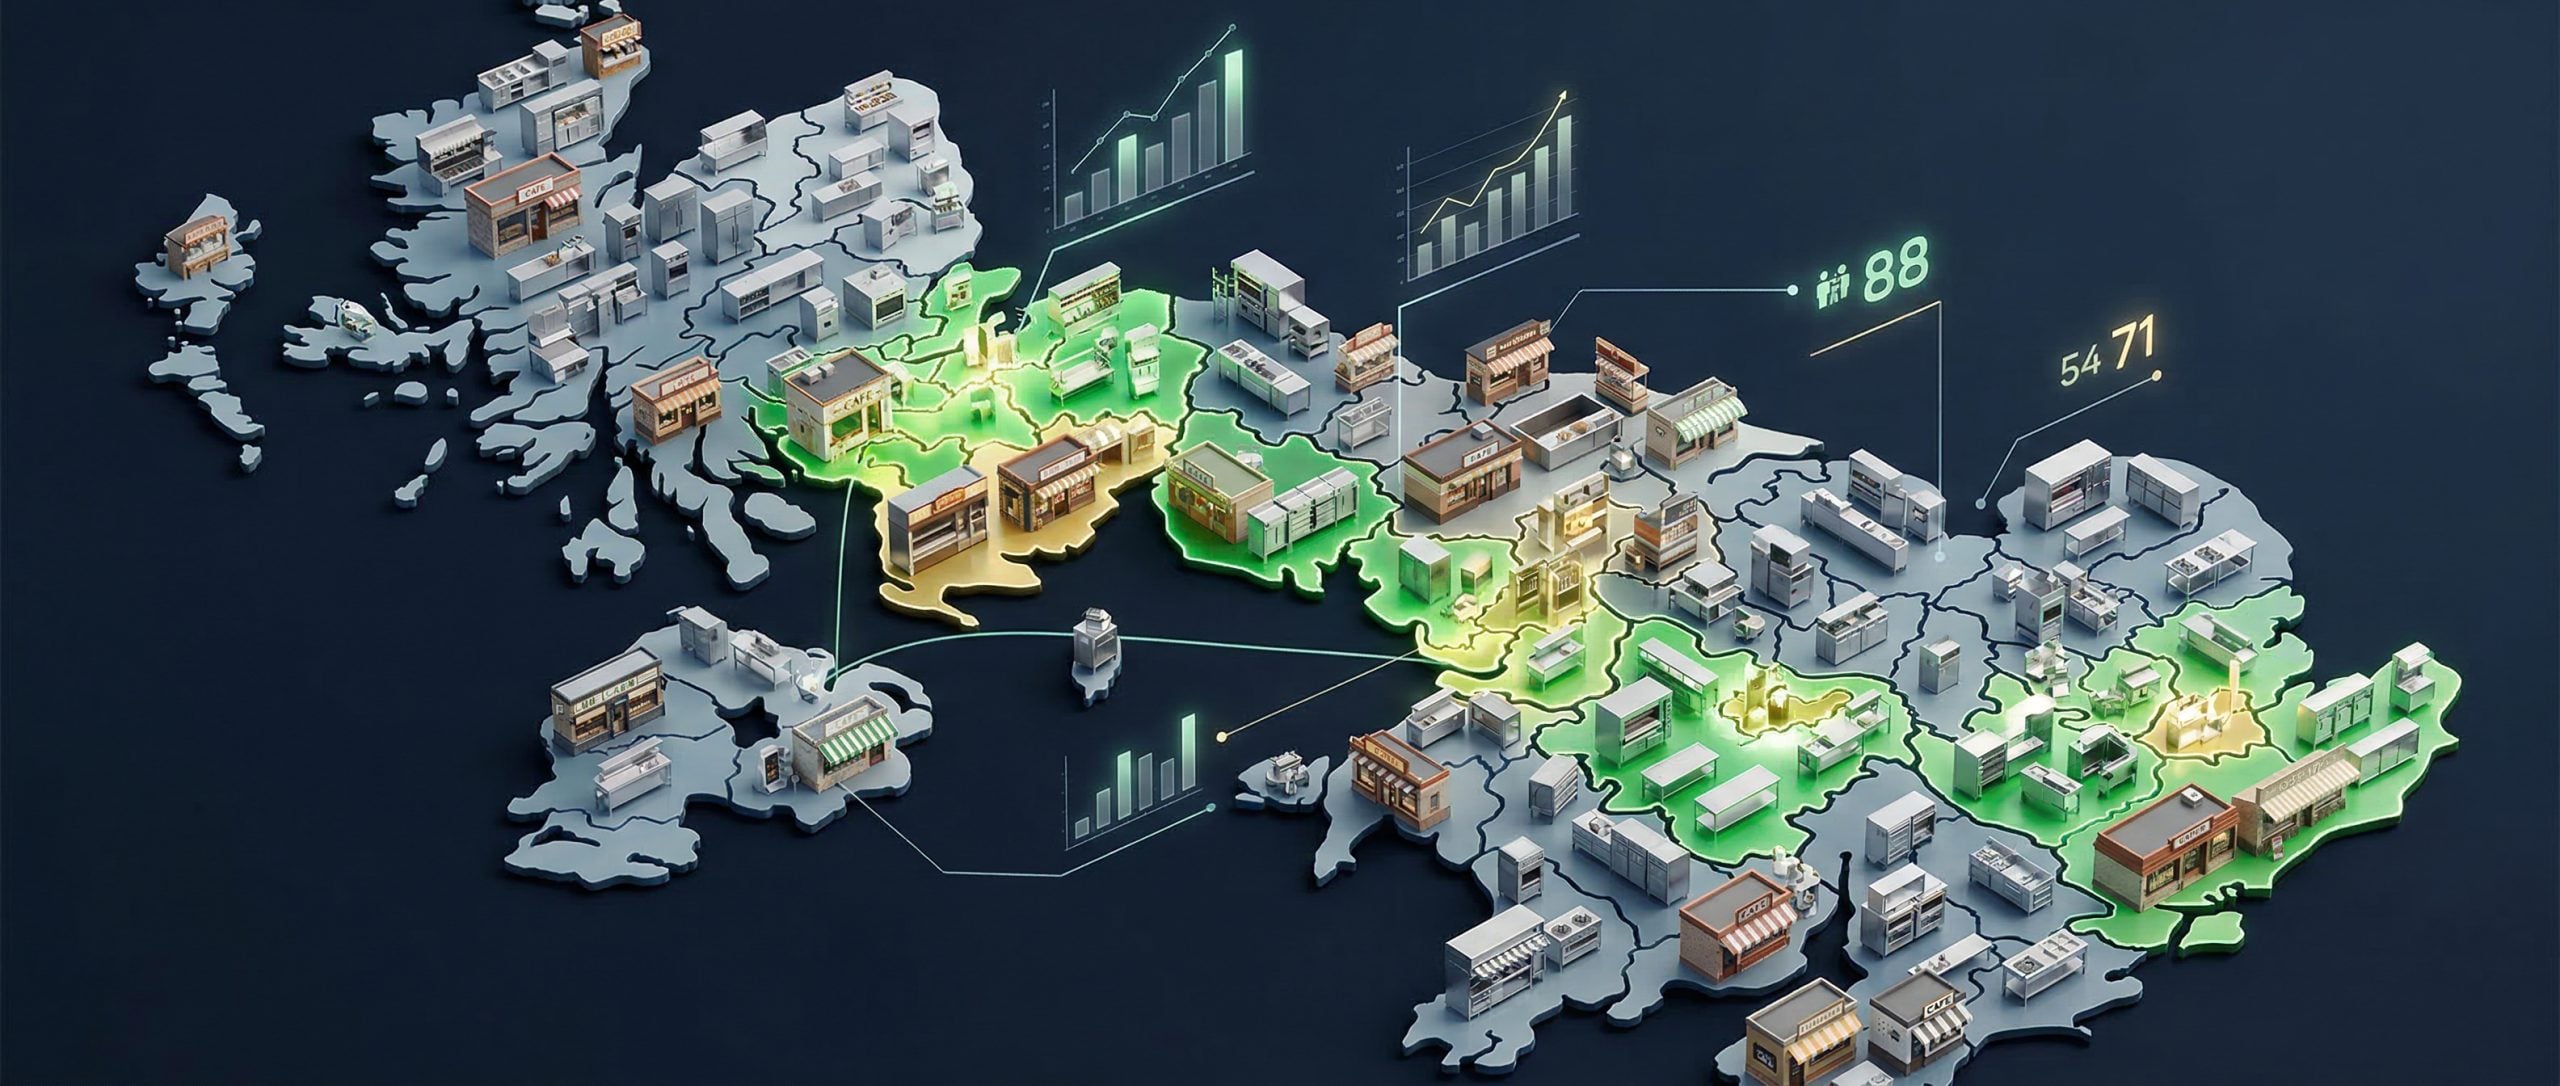
Not all locations are equal. Some UK cities have surging demand, low competition, and affordable premises. Others are saturated, expensive, and stagnant. The problem is that nobody has published a definitive, data-backed ranking. Until now.
We built a composite index that scores every major UK local authority on five dimensions, using data from seven public sources: the Food Standards Agency, ONS population estimates (via the Nomis API), Companies House, the English Indices of Deprivation 2025, VOA rateable values, Police UK crime data, and the DLUHC planning data platform.
Each location gets five sub-scores, normalised to a 0-100 scale:
- Demand (25%). How many people per food business? Higher numbers mean more potential customers for each establishment. Weight: 25%
- Growth (20%). What proportion of businesses were recently registered? Areas with a high share of new registrations (rated by the FSA in 2024 or later) signal a growing market. Weight: 20%
- Competition (20%). How saturated is the market? This is the inverse of food businesses per 10,000 people. Fewer businesses relative to population means less competition. Weight: 20%
- Affordability (20%). How cheap are commercial premises? Using VOA rateable values as a proxy for commercial rents, cheaper areas score higher. Weight: 20%
- Consumer Spending Power (15%). Do residents have money to spend? Based on the Indices of Multiple Deprivation 2025, less deprived areas score higher. Weight: 15%
322 local authorities scored. 7 public data sources. 5 scoring dimensions. The first composite food business opportunity ranking for the UK.
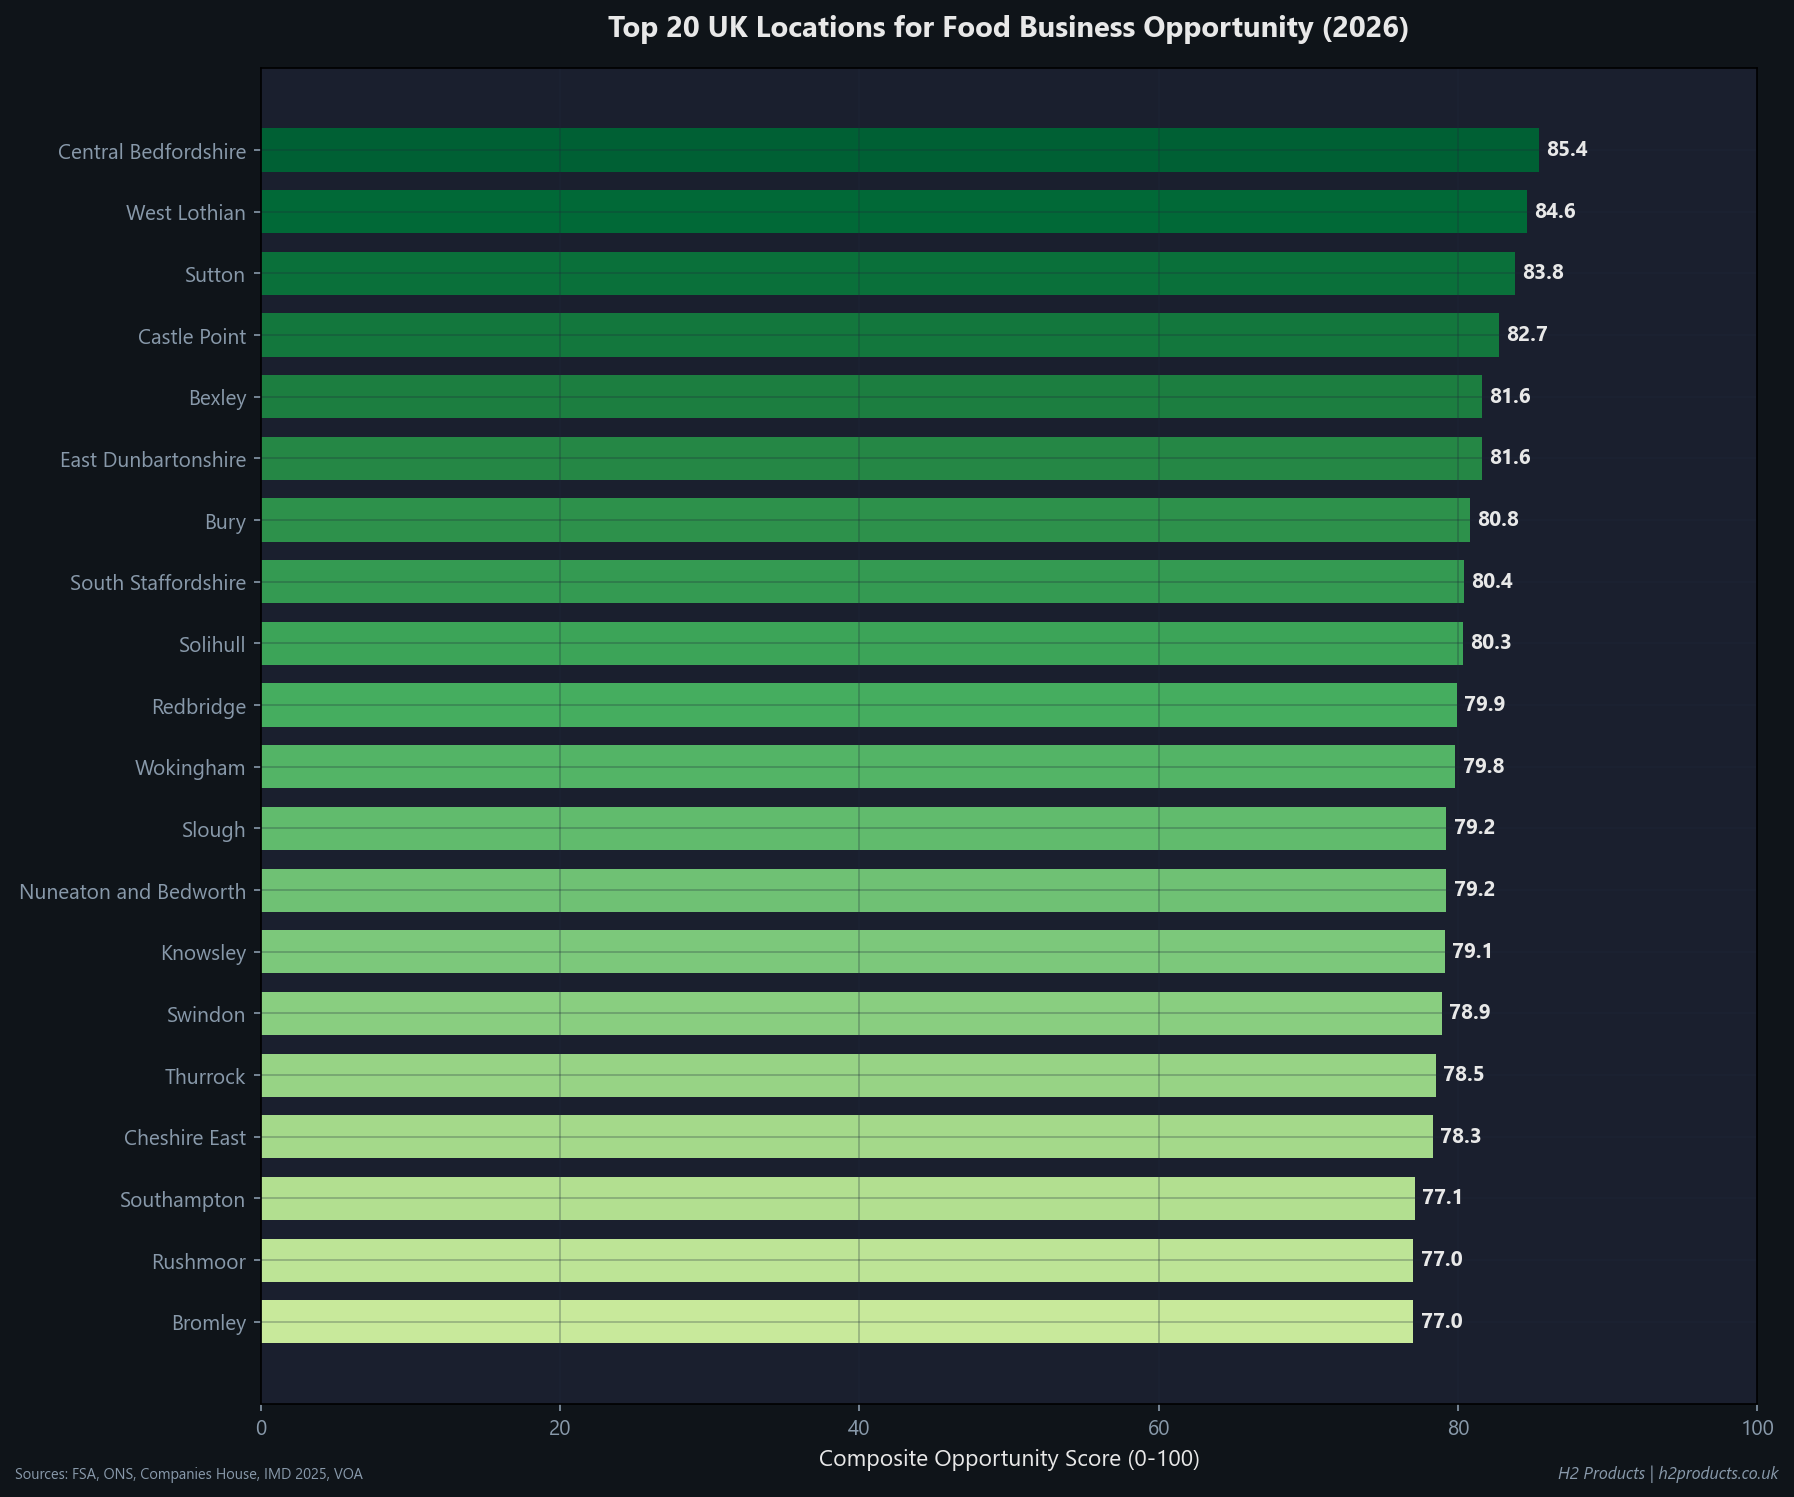
The Top 20: Where to Open a Food Business in 2026
Central Bedfordshire leads the rankings with a composite score of 85.4, followed by West Lothian (84.6) and Sutton (83.8). The top 20 is dominated by areas that combine relatively low food business density with strong population bases and affordable commercial premises.
| # | Local Authority | Region | Score | Demand | Growth | Comp. | Afford. | Spend |
| 1 | Central Bedfordshire | East of England | 85.4 | 87 | 84 | 97 | 90 | 63 |
| 2 | West Lothian | Scotland | 84.6 | 73 | 100 | 94 | 90 | 63 |
| 3 | Sutton | London | 83.8 | 73 | 80 | 94 | 82 | 96 |
| 4 | Castle Point | East of England | 82.7 | 79 | 83 | 95 | 90 | 63 |
| 5 | Bexley | London | 81.6 | 63 | 84 | 91 | 84 | 94 |
| 6 | East Dunbartonshire | Scotland | 81.6 | 73 | 86 | 94 | 90 | 63 |
| 7 | Bury | North West | 80.8 | 73 | 78 | 94 | 93 | 63 |
| 8 | South Staffordshire | West Midlands | 80.4 | 71 | 83 | 93 | 90 | 63 |
| 9 | Solihull | West Midlands | 80.3 | 70 | 84 | 93 | 90 | 63 |
| 10 | Redbridge | London | 79.9 | 68 | 80 | 92 | 80 | 84 |
| 11 | Wokingham | South East | 79.8 | 76 | 72 | 95 | 90 | 63 |
| 12 | Slough | South East | 79.2 | 77 | 78 | 95 | 90 | 50 |
| 13 | Nuneaton and Bedworth | West Midlands | 79.2 | 69 | 80 | 93 | 90 | 63 |
| 14 | Knowsley | North West | 79.1 | 100 | 72 | 100 | 96 | 3 |
| 15 | Swindon | South West | 78.9 | 67 | 78 | 92 | 90 | 66 |
| 16 | Thurrock | East of England | 78.5 | 62 | 88 | 90 | 90 | 63 |
| 17 | Cheshire East | North West | 78.3 | 58 | 93 | 88 | 90 | 63 |
| 18 | Southampton | South East | 77.1 | 66 | 84 | 92 | 86 | 55 |
| 19 | Rushmoor | South East | 77.0 | 66 | 73 | 92 | 90 | 63 |
| 20 | Bromley | London | 77.0 | 58 | 79 | 89 | 76 | 91 |
What makes Central Bedfordshire the top-ranked location? It scores 87 for demand, meaning there are relatively few food businesses per head of population. Its competition score of 97 confirms the market is not yet saturated. And with an affordability score of 90, the cost of commercial premises is well below the national average.
4 London borough(s) made the top 20: Sutton, Bexley, Redbridge, Bromley. These are outer boroughs where demand outstrips supply without the inner-London rent premium.
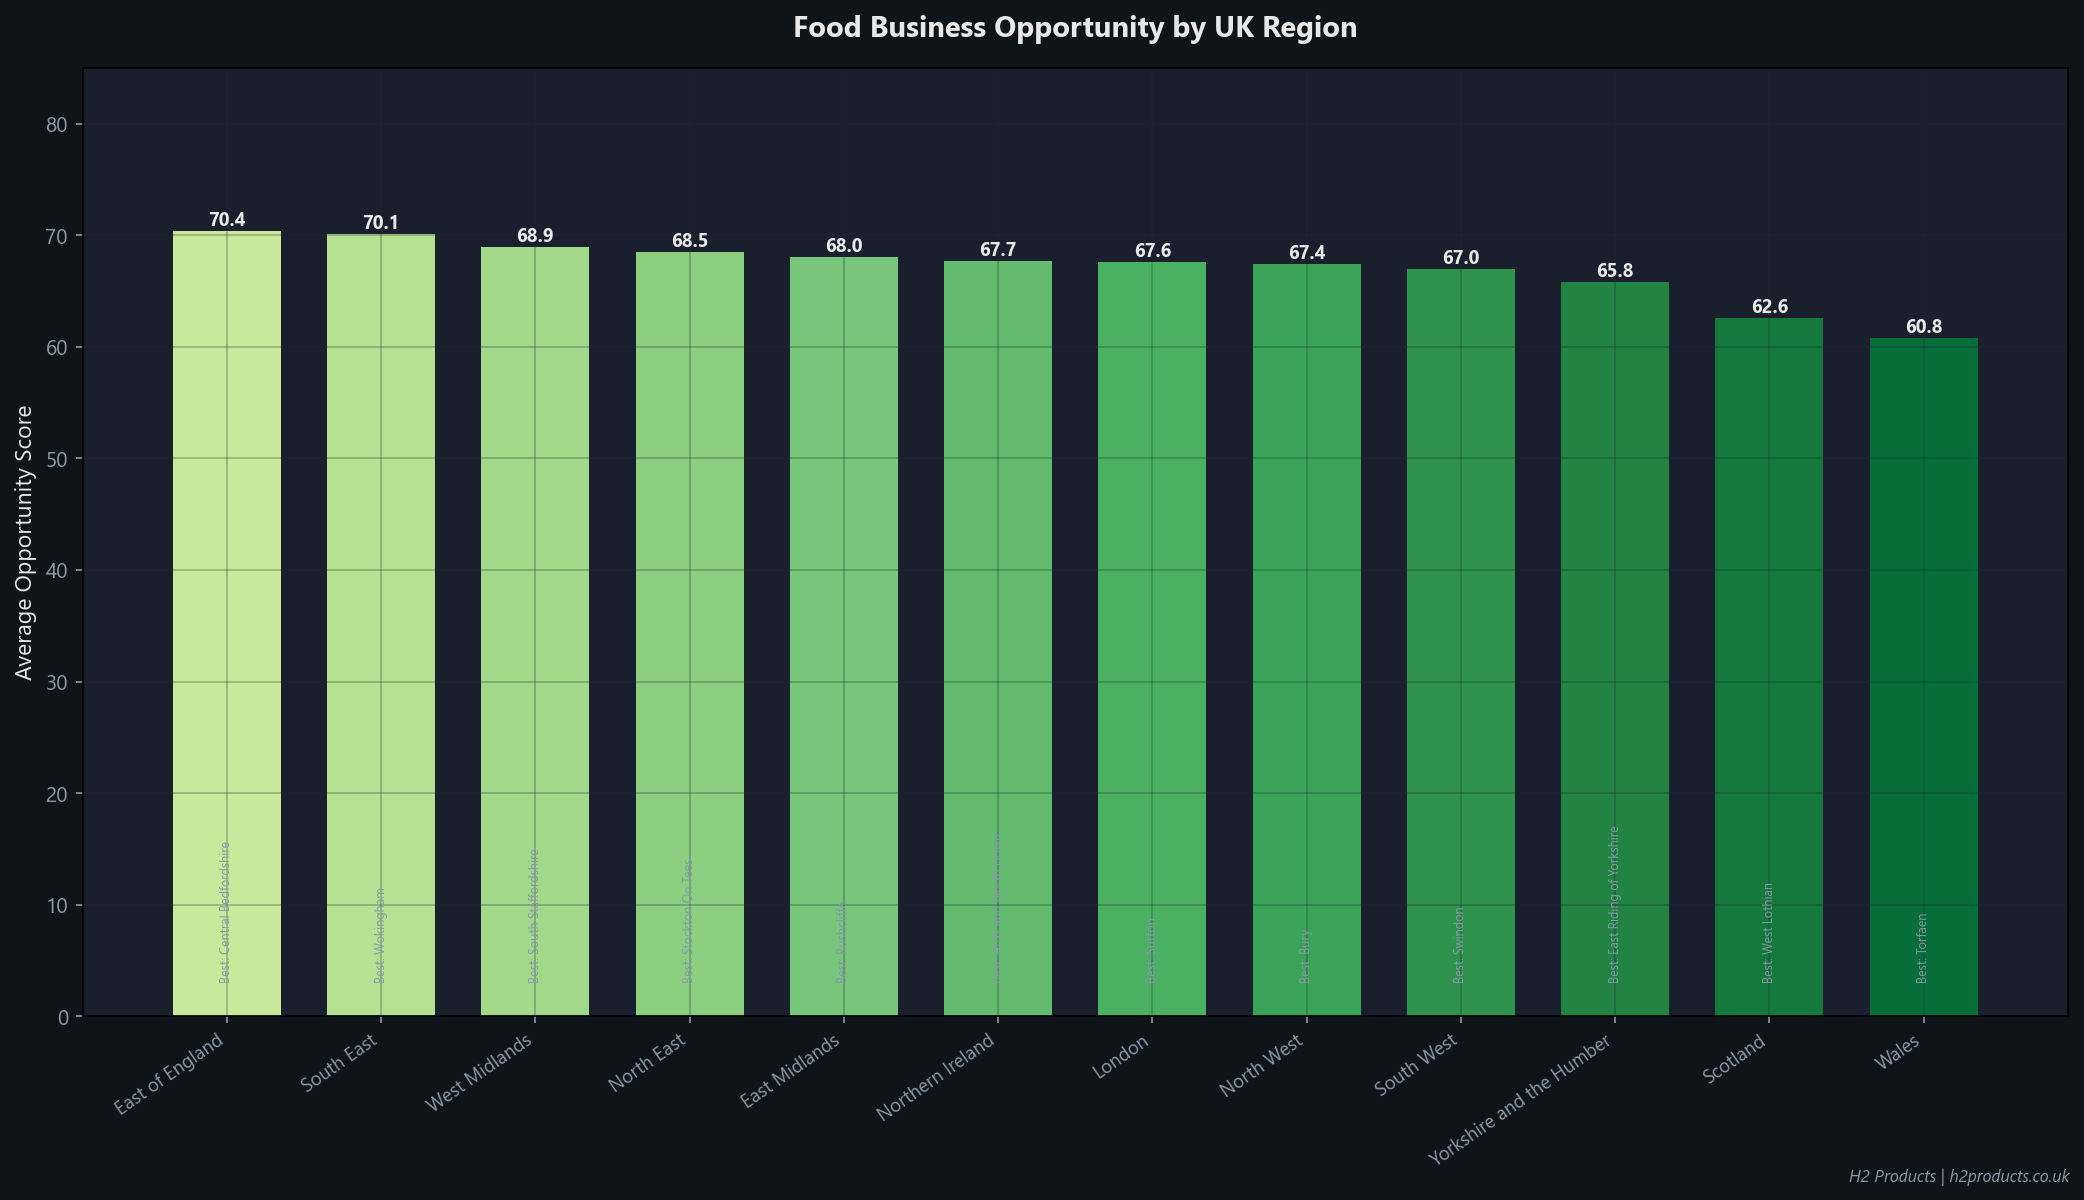
Regional Breakdown: Best Regions for Food Startups
When you average the scores across all local authorities within each region, a clear pattern emerges. The strongest regions combine growing populations with room for new businesses and reasonable rents.
| Region | LAs | Avg Score | Top LA | Top Score |
| East of England | 38 | 70.4 | Central Bedfordshire | 85.4 |
| South East | 58 | 70.1 | Wokingham | 79.8 |
| West Midlands | 26 | 68.9 | South Staffordshire | 80.4 |
| North East | 12 | 68.5 | Stockton On Tees | 74.8 |
| East Midlands | 30 | 68.0 | Rushcliffe | 75.4 |
| Northern Ireland | 11 | 67.7 | Ards and North Down | 73.7 |
| London | 30 | 67.6 | Sutton | 83.8 |
| North West | 30 | 67.4 | Bury | 80.8 |
| South West | 19 | 67.0 | Swindon | 78.9 |
| Yorkshire and the Humber | 13 | 65.8 | East Riding of Yorkshire | 71.3 |
| Scotland | 29 | 62.6 | West Lothian | 84.6 |
| Wales | 22 | 60.8 | Torfaen | 70.3 |
East of England leads regionally with an average score of 70.4. The region benefits from strong demand scores and moderate costs. Wales comes last at 60.8, pulled down by lower demand relative to the number of existing food businesses.
The Sweet Spots: Affordable Areas With Growing Demand
The most interesting places to open a food business are those that sit in the “sweet spot” quadrant: affordable commercial rents combined with strong growth in new registrations. These are areas where the market is expanding and the barriers to entry are low.
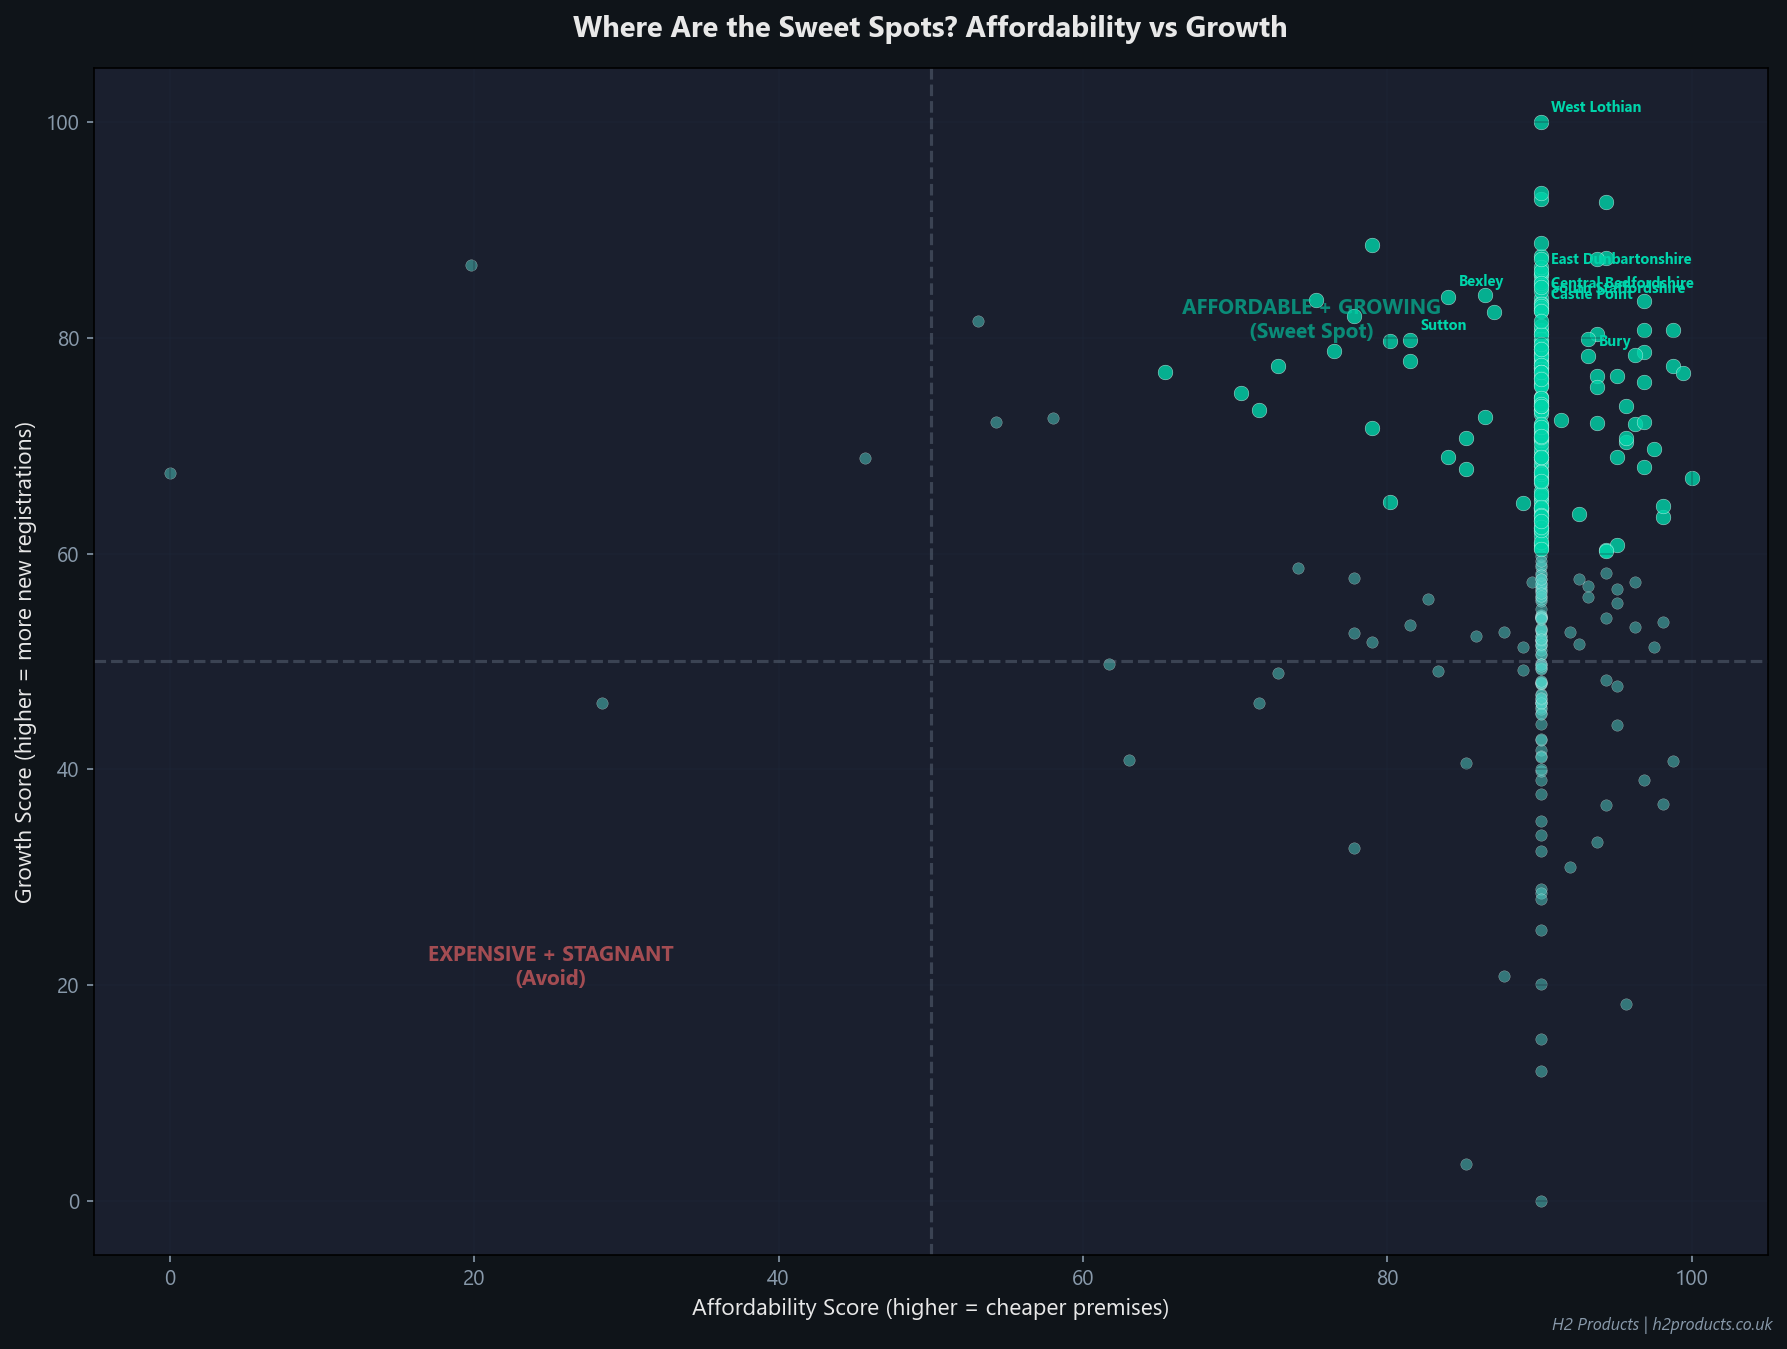
The top sweet spot locations, where affordability and growth both score above average:
- Central Bedfordshire (Rank #1): Affordability 90, Growth 84, Composite 85.4
- West Lothian (Rank #2): Affordability 90, Growth 100, Composite 84.6
- Sutton (Rank #3): Affordability 82, Growth 80, Composite 83.8
- Castle Point (Rank #4): Affordability 90, Growth 83, Composite 82.7
- Bexley (Rank #5): Affordability 84, Growth 84, Composite 81.6
- East Dunbartonshire (Rank #6): Affordability 90, Growth 86, Composite 81.6
- Bury (Rank #7): Affordability 93, Growth 78, Composite 80.8
- South Staffordshire (Rank #8): Affordability 90, Growth 83, Composite 80.4
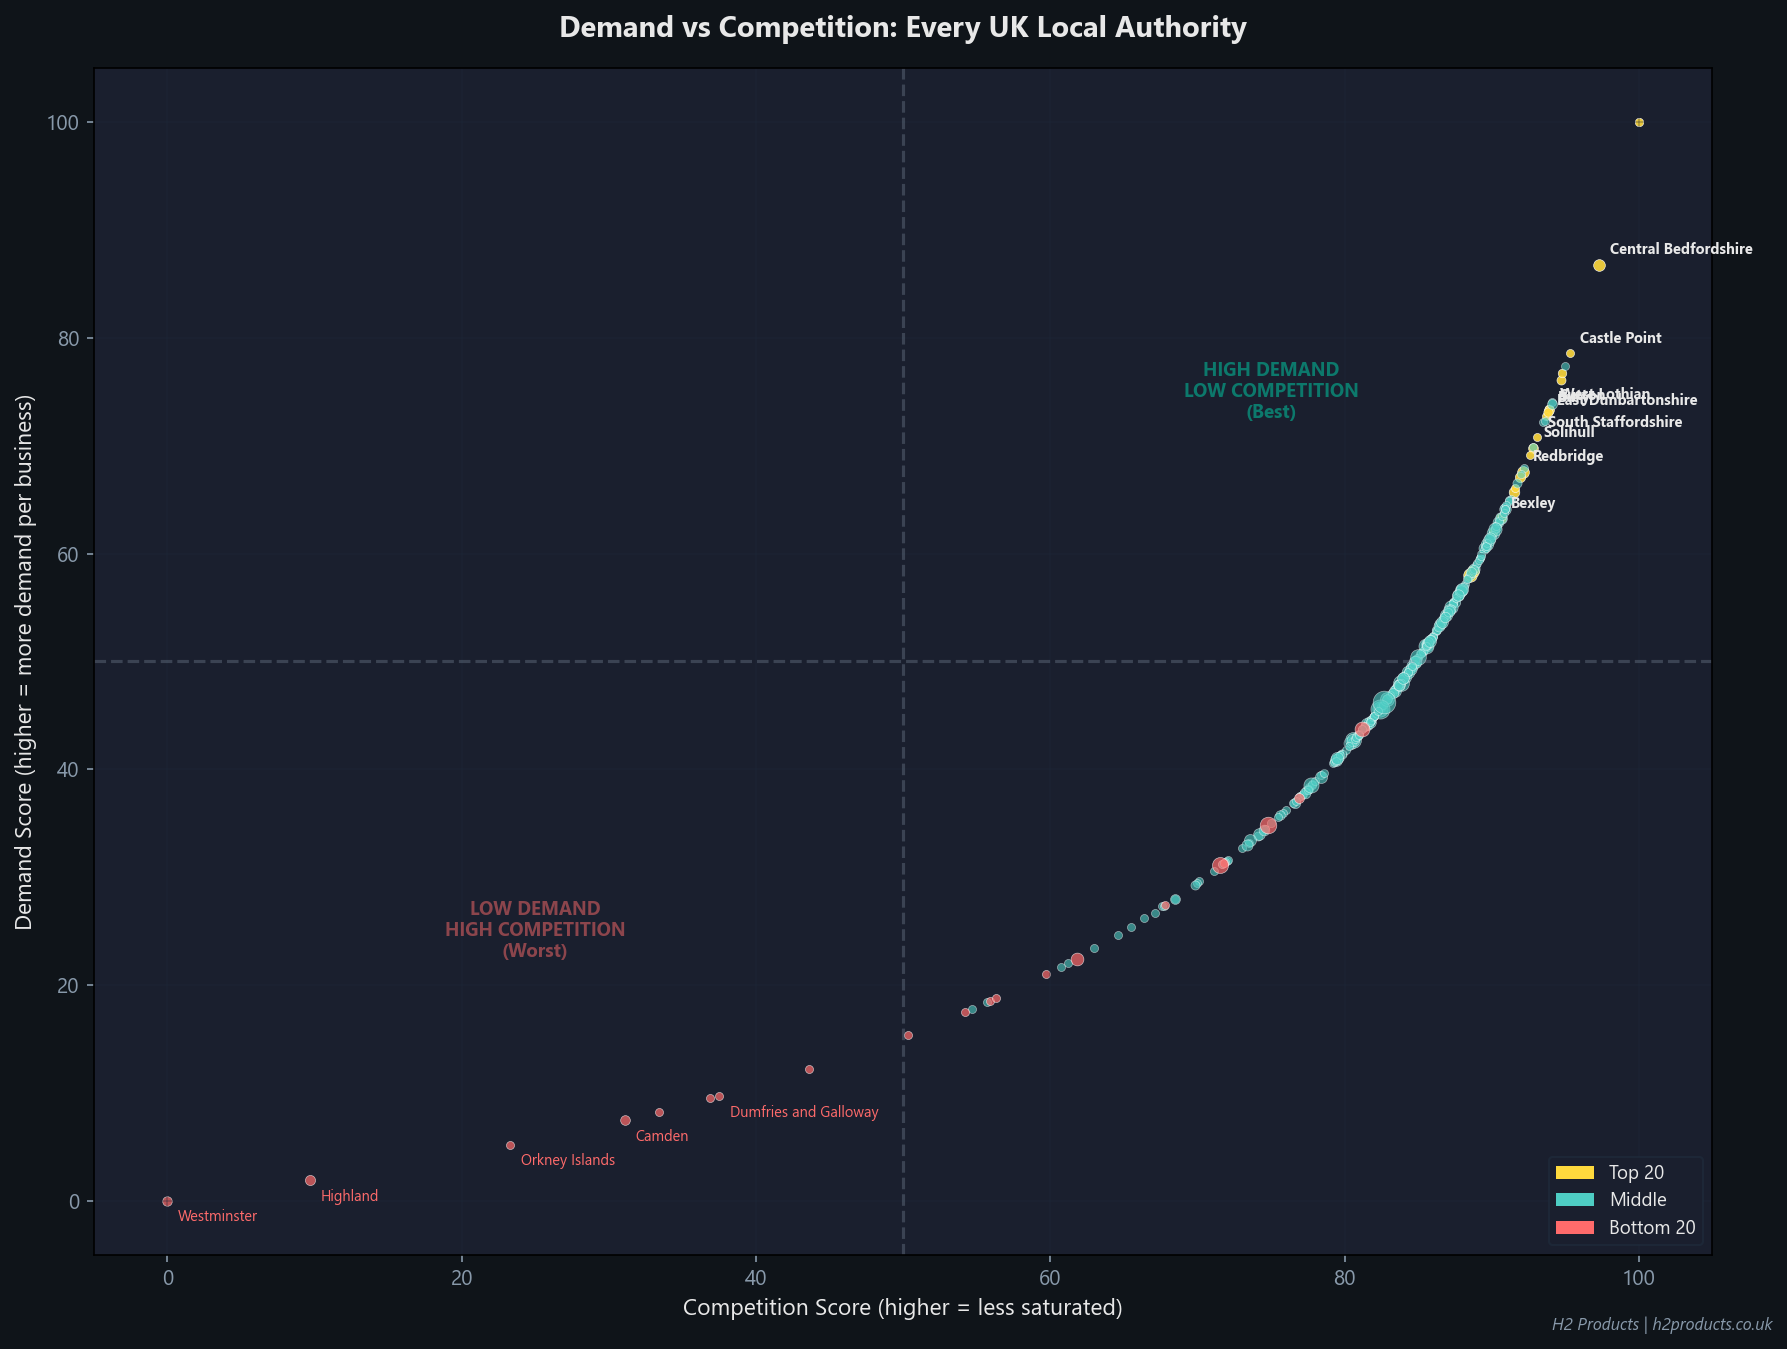
Where NOT to Open: The Most Saturated Markets
The bottom of the ranking tells its own story. These are areas where food business density is already high, commercial rents are steep, or the combination of factors makes it much harder for a new entrant to gain traction.
| # | Local Authority | Region | Score | Businesses/10k | Pop/Business |
| 313 | Liverpool | North West | 50.1 | 88.3 | 113 |
| 314 | Pembrokeshire | Wales | 48.7 | 184.8 | 54 |
| 315 | Fife | Scotland | 48.1 | 130.7 | 77 |
| 316 | East Lindsey | East Midlands | 47.1 | 155.6 | 64 |
| 317 | Powys | Wales | 44.2 | 192.5 | 52 |
| 318 | Orkney Islands | Unknown | 41.4 | 214.4 | 47 |
| 319 | Dumfries and Galloway | Scotland | 37.4 | 183.5 | 54 |
| 320 | Highland | Scotland | 36.9 | 244.1 | 41 |
| 321 | Camden | London | 34.7 | 197.3 | 51 |
| 322 | Westminster | London | 25.4 | 265.1 | 38 |
Westminster sits at the bottom of the ranking with a score of just 25.4. It has 265.1 food businesses per 10,000 residents, meaning the market is heavily saturated. Combined with the highest commercial rents in the country, the economics of opening a new food business here are particularly tough.
That does not mean success is impossible in these areas. A strong concept with clear differentiation can work anywhere. But the data shows that new operators need to compete harder for a smaller share of the market in these locations.
What This Means for Kitchen Equipment Demand
Every food business that opens needs a kitchen. Every kitchen needs equipment. The geographical patterns in this index have direct implications for where equipment demand will be strongest over the next 12 months.
The areas at the top of our ranking share a profile:
- Growing populations with relatively few food businesses per head. This creates demand for entirely new kitchen setups rather than just replacements
- Affordable commercial rents, which means more of the startup budget can go towards equipment rather than rent deposits
- Active FSA registration pipelines, with thousands of new businesses awaiting their first hygiene inspection. Each of those businesses needs commercial fridges, ovens, fryers, prep tables, and extraction systems
A typical takeaway kitchen fit-out includes a commercial fryer, commercial oven or combi oven, prep counter fridge, commercial fridge and freezer, bain marie, stainless steel prep tables, commercial sink, and extraction ventilation. At full retail, that runs between £15,000 and £35,000.
B-Grade catering equipment offers the same specification at 30 to 50% less. Every item is brand new with a full manufacturer warranty. The only difference is cosmetic. For operators in the affordable, high-opportunity areas that top our ranking, that saving can be the difference between opening and not opening.
Browse the full range at h2products.co.uk/product-category/b-grade-catering-equipment, or view brand new equipment at h2products.co.uk/product-category/brand-new.
The Full Top 50 Ranking
The complete ranking with all five sub-scores. Use this table to find your area and compare it against the national picture.
| # | Local Authority | Region | Score | Dem. | Gro. | Comp. | Aff. | Sp. |
| 1 | Central Bedfordshire | East of England | 85.4 | 87 | 84 | 97 | 90 | 63 |
| 2 | West Lothian | Scotland | 84.6 | 73 | 100 | 94 | 90 | 63 |
| 3 | Sutton | London | 83.8 | 73 | 80 | 94 | 82 | 96 |
| 4 | Castle Point | East of England | 82.7 | 79 | 83 | 95 | 90 | 63 |
| 5 | Bexley | London | 81.6 | 63 | 84 | 91 | 84 | 94 |
| 6 | East Dunbartonshire | Scotland | 81.6 | 73 | 86 | 94 | 90 | 63 |
| 7 | Bury | North West | 80.8 | 73 | 78 | 94 | 93 | 63 |
| 8 | South Staffordshire | West Midlands | 80.4 | 71 | 83 | 93 | 90 | 63 |
| 9 | Solihull | West Midlands | 80.3 | 70 | 84 | 93 | 90 | 63 |
| 10 | Redbridge | London | 79.9 | 68 | 80 | 92 | 80 | 84 |
| 11 | Wokingham | South East | 79.8 | 76 | 72 | 95 | 90 | 63 |
| 12 | Slough | South East | 79.2 | 77 | 78 | 95 | 90 | 50 |
| 13 | Nuneaton and Bedworth | West Midlands | 79.2 | 69 | 80 | 93 | 90 | 63 |
| 14 | Knowsley | North West | 79.1 | 100 | 72 | 100 | 96 | 3 |
| 15 | Swindon | South West | 78.9 | 67 | 78 | 92 | 90 | 66 |
| 16 | Thurrock | East of England | 78.5 | 62 | 88 | 90 | 90 | 63 |
| 17 | Cheshire East | North West | 78.3 | 58 | 93 | 88 | 90 | 63 |
| 18 | Southampton | South East | 77.1 | 66 | 84 | 92 | 86 | 55 |
| 19 | Rushmoor | South East | 77.0 | 66 | 73 | 92 | 90 | 63 |
| 20 | Bromley | London | 77.0 | 58 | 79 | 89 | 76 | 91 |
| 21 | Merton | London | 77.0 | 64 | 73 | 91 | 72 | 92 |
| 22 | Hart | South East | 76.8 | 72 | 63 | 94 | 90 | 63 |
| 23 | North Somerset | South West | 76.7 | 58 | 85 | 88 | 90 | 63 |
| 24 | Gravesham | South East | 76.6 | 57 | 86 | 88 | 90 | 63 |
| 25 | Greenwich | London | 76.4 | 54 | 84 | 86 | 75 | 93 |
| 26 | Redditch | West Midlands | 76.3 | 77 | 52 | 95 | 90 | 63 |
| 27 | East Renfrewshire | Scotland | 76.3 | 65 | 71 | 91 | 90 | 63 |
| 28 | Broadland | East of England | 76.1 | 63 | 74 | 90 | 90 | 63 |
| 29 | Newham | London | 76.1 | 62 | 82 | 90 | 78 | 71 |
| 30 | Woking | South East | 76.1 | 59 | 81 | 89 | 90 | 63 |
| 31 | Basildon | East of England | 76.0 | 61 | 77 | 90 | 90 | 63 |
| 32 | Waltham Forest | London | 76.0 | 60 | 89 | 90 | 79 | 63 |
| 33 | Bracknell Forest | South East | 75.9 | 72 | 58 | 94 | 90 | 63 |
| 34 | Fareham | South East | 75.8 | 65 | 69 | 91 | 90 | 63 |
| 35 | Guildford | South East | 75.8 | 57 | 83 | 88 | 90 | 63 |
| 36 | Welwyn Hatfield | East of England | 75.7 | 74 | 54 | 94 | 90 | 63 |
| 37 | Runnymede | South East | 75.7 | 56 | 83 | 88 | 90 | 63 |
| 38 | Inverclyde | Scotland | 75.7 | 50 | 93 | 85 | 90 | 63 |
| 39 | Harrow | London | 75.6 | 63 | 72 | 90 | 90 | 63 |
| 40 | Spelthorne | South East | 75.5 | 60 | 76 | 89 | 90 | 63 |
| 41 | South Gloucestershire | South West | 75.5 | 64 | 69 | 91 | 90 | 63 |
| 42 | Rushcliffe | East Midlands | 75.4 | 57 | 80 | 88 | 90 | 63 |
| 43 | Lichfield | West Midlands | 75.3 | 54 | 85 | 87 | 90 | 63 |
| 44 | Tameside | North West | 75.3 | 62 | 87 | 90 | 94 | 35 |
| 45 | Falkirk | Scotland | 75.3 | 55 | 83 | 87 | 90 | 63 |
| 46 | Epping Forest | East of England | 75.2 | 60 | 74 | 90 | 90 | 63 |
| 47 | Basingstoke and Deane | South East | 75.1 | 66 | 63 | 92 | 90 | 63 |
| 48 | Medway | South East | 74.9 | 59 | 79 | 89 | 90 | 57 |
| 49 | Stockton On Tees | North East | 74.8 | 56 | 78 | 88 | 90 | 63 |
| 50 | Tewkesbury | South West | 74.8 | 54 | 83 | 87 | 90 | 63 |
Frequently Asked Questions
What is the best city to open a restaurant in the UK?
According to our Food Business Opportunity Index, the best locations for a new food business in 2026 are Central Bedfordshire (score: 85.4), West Lothian (84.6), and Sutton (83.8). These areas combine high demand, low competition, and affordable commercial rents.
Where is the best place to open a takeaway in the UK?
The same index applies to takeaways as to restaurants. Areas with high demand scores and low competition scores offer the most room for new takeaway businesses. Central Bedfordshire, Castle Point, and Bexley all score highly on these metrics.
Which UK city has the cheapest commercial rent for food businesses?
Based on VOA rateable values (a proxy for commercial rents), the cheapest areas for food business premises include parts of South Wales, the North East, and smaller towns in the East Midlands. Blaenau Gwent, Merthyr Tydfil, and Burnley have some of the lowest rateable values per square metre in the UK.
How many food businesses are there in the UK?
The Food Standards Agency registers 602,923 active food establishments across the United Kingdom as of March 2026. This includes restaurants, takeaways, pubs, hotels, retailers, manufacturers, and all other food-handling businesses.
What is the most saturated city for restaurants in the UK?
Westminster has the lowest opportunity score in our index (25.4), driven by intense competition and the highest commercial rents in the country. Camden and Highland are also near the bottom.
How much does it cost to open a takeaway in 2026?
A standard takeaway kitchen fit-out costs between £15,000 and £35,000 for equipment at full retail prices. This covers a commercial fryer, oven, prep fridge, commercial fridge and freezer, bain marie, stainless steel tables, commercial sink, and extraction. B-Grade equipment reduces this by 30 to 50%.
What equipment do I need for a commercial kitchen?
The core equipment list depends on your food type, but most commercial kitchens need: a commercial oven or combi oven, commercial refrigeration (fridge and freezer), stainless steel preparation surfaces, a commercial sink, and extraction ventilation. Takeaways typically add a commercial fryer and bain marie. Full-service restaurants may need a wider range including salamanders, chargrills, and additional cold storage.
Is the UK restaurant market growing or shrinking?
The UK food service market is growing. Companies House data shows that new hospitality company registrations have consistently outpaced dissolutions since 2023. The FSA register shows 49,547 businesses currently awaiting their first hygiene inspection, indicating a strong pipeline of new openings. The market is projected to reach £108.7 billion by 2028.
What are the best areas for a fish and chip shop?
Coastal and Northern towns tend to have the strongest demand for fish and chips. Areas like East Lindsey (Lincolnshire coast), Scarborough (North Yorkshire), and Blackpool all have established fish and chip cultures. Our index shows several of these areas still have room for new entrants despite the existing competition.
How do I choose a location for my food business?
Five factors matter most: demand (population per food business), competition (how many similar businesses already operate), affordability (commercial rent levels), growth (whether the area is attracting new food businesses), and consumer spending power (local income levels). Our Food Business Opportunity Index combines all five into a single score for every UK local authority.
Data Sources and Methodology
This analysis combines seven public data sources, all freely available. The methodology is transparent and reproducible.
| Source | Data Used | Access |
| Food Standards Agency API | All 602,923 registered food establishments by local authority, business type, rating value, and rating date. | Free public API (api.ratings.food.gov.uk) |
| ONS Population Estimates (Nomis API) | Mid-2024 population estimates by local authority district for England. Scotland, Wales and NI from NRS, StatsWales, NISRA. | Free public API (nomisweb.co.uk/api) |
| Companies House Advanced Search API | Monthly incorporation and dissolution counts for all hospitality SIC codes (55xxx, 56xxx) from January 2023 to February 2026. | Free API key (api.company-information.service.gov.uk) |
| English Indices of Deprivation 2025 | Average IMD rank per local authority as a proxy for consumer spending power. Scottish SIMD 2020 and Welsh WIMD 2025 used for devolved nations. | Free download (gov.uk) |
| VOA Non-Domestic Rating (2023 Revaluation) | Rateable values per square metre for retail premises by local authority, used as a commercial rent proxy. | Free download (gov.uk / London Datastore) |
| Police UK Crime Data | Crime rates by location used for safety context. | Free public API (data.police.uk/api) |
| DLUHC Planning Data | Change-of-use planning applications as a leading indicator of new food business openings. | Free public API (planning.data.gov.uk) |
Composite Index Methodology:
- Each of the five scoring dimensions is normalised to a 0-100 scale across all local authorities in the dataset
- The composite score is a weighted average: Demand 25%, Growth 20%, Competition 20%, Affordability 20%, Consumer Spending Power 15%
- Only local authorities with a population above 20,000 are included to avoid ranking very small or unusual areas (e.g. Isles of Scilly)
- Growth is measured using FSA rating dates as a proxy: the proportion of establishments rated in 2024 or later indicates recent registration activity
- The index will be updated annually as new FSA, ONS, and IMD data are released
All FSA data is a live snapshot as of March 2026. Population estimates are ONS mid-2024 figures retrieved from the Nomis API. IMD 2025 figures are from the GOV.UK publication of October 2025.
